
IASC-ERS Report on Webinar Course “Functional Data Analysis for Density Functions in Bayes Spaces”
April 29-30, 2021
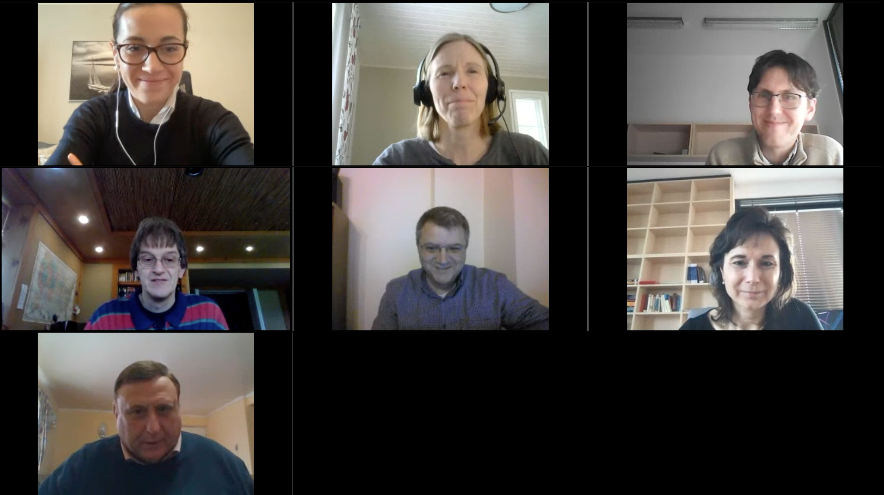
(From left to right) Alessandra Menafoglio, Sara Taskinen, Karel Hron, Juergen Symanzik, Cristian Gatu, Jitka Machalová and Luis Firinguetti-Limone.
The European Regional Section of the International Association for Statistical Computing (IASC-ERS), the International Association for Statistical Computing (IASC), and the International Statistical Institute (ISI) held a successful Webinar on functional data analysis on April 29-30, 2021. The IASC-ERS Webinar Course “An Introduction to Functional Data Analysis for Density Functions in Bayes Spaces” was team-taught by Alessandra Menafoglio (Politecnico di Milano), Karel Hron (Palacký University) and Jitka Machalová (Palacký University).
175 students pre-registered for the course on the GoToWebinar platform. 132 (75%) students attended the course on the first day and 94 (54%) on the second day. Participants came from 44 different countries: Argentina, Australia, Austria, Belgium, Brazil, Canada, Chile, China, Côte d’Ivoire, Croatia, Czech Republic, Denmark, Finland, France, Germany, Ghana, India, Indonesia, Iran, Ireland, Israel, Italy, Japan, Kazakhstan, Macedonia, Mexico, New Zealand, Nigeria, Norway, Pakistan, Philippines, Poland, Portugal, Republic of Korea, Romania, Saudi Arabia, Slovenia, South Africa, Spain, Sweden, Switzerland, Turkey, United Kingdom and United States. Participants were academics (33%), PhD and Master students (29%), researchers (26%), and professionals coming from government institutions and private industry (9%).
The International Organizing Committee consisted of Cristian Gatu (IASC-ERS Chairperson, Romania), Sara Taskinen (IASC-ERS Scientific Secretary, Finland) and Luis Firinguetti-Limone (IASC Webinar Coordinator, Chile). Katie Junasova, Junior Webmaster at the International Statistical Institute, provided support with the organization and with the GoToWebinar platform, and Juergen Symanzik, President of IASC, helped with organizing the Webinar.
The webinar course was supported by the European Regional Section of the International Association for Statistical Computing (IASC-ERS), the International Association for Statistical Computing (IASC), and the International Statistical Institute (ISI).
Objectives of the IASC-ERS School on Computational Statistics and Data Science
- To spread the knowledge base and advances in Statistical Computing in Latin America and the world,
- To provide an overview of the state-of-the-art of the ongoing research in computational statistics,
- To provide an overall perspective of the application of computational statistics in data science problems,
- To present applications where computational statistics have been crucial to solve problems in real-life applications, and
- To increase the number of researchers and practitioners in computational statistics and data science.
Agenda and course program.
Thursday, April 29th 2021:
- Opening: 14h00 – 14h15
- Session 1: 14h15 – 15h00 (The geometry of Bayes spaces)
- Session 2: 15h10 – 15h55 (Smoothing splines for densities)
- Session 3: 16h05 – 16h50 (Dimensionality reduction in Bayes spaces: Simplicial Functional Principal Component Analysis)
Friday, April 30th 2021:
- Session 1: 14h00 – 14h45 (Anomaly detection for density data based on control charts)
- Session 2: 14h55 – 15h40 (Density-on-scalar, scalar-on-density and density-on-density functional regression)
- Session 3: 15h50 – 16h35 (Spatial statistics for distributional observations: spatial modeling & kriging)
- Closing: 16h35 – 16h45
Number of students by day
| Date | Attendance |
| Thursday, April 29 | 132 |
| Friday, April 30 | 94 |
| Total (without replication) | 135 |
Number of students with registration form (country, gender, and occupation): 175
Number of students attending 1 or 2 days
| Category | Attendance | Percentage (%) |
| Both days | 91 | 67.4 |
| Thursday, April 29 only | 43 | 31.9 |
| Friday, April 30 only | 1 | 0.7 |
| Total | 135 | 100.00 |
Number of (registered) students by gender
| Gender | Attendance | Percentage (%) |
| Female | 69 | 39.4 |
| Male | 106 | 60.6 |
| Total | 175 | 100.00 |
Number of (registered) students by occupation
| Occupation | Attendance | Percentage (%) |
| Academic | 58 | 33.1 |
| PhD and Master Students | 50 | 28.6 |
| Researcher | 46 | 26.3 |
| Business and industry professional, Government officer | 16 | 9.1 |
| Other | 5 | 0.6 |
| Total | 175 | 100.00 |
Number of (registered) students by country
| Country | Attendance | Percentage (%) | Country | Attendance | Percentage (%) |
| Argentina | 1 | 0.6 | Japan | 2 | 1.1 |
| Australia | 5 | 2.9 | Kazakhstan | 1 | 0.6 |
| Austria | 1 | 0.6 | Macedonia | 1 | 0.6 |
| Belgium | 1 | 0.6 | Mexico | 1 | 0.6 |
| Brazil | 2 | 1.1 | New Zealand | 1 | 0.6 |
| Canada | 5 | 2.9 | Nigeria | 1 | 0.6 |
| Chile | 2 | 1.1 | Norway | 3 | 1.7 |
| China | 4 | 2.3 | Pakistan | 1 | 0.6 |
| Côte d’Ivoire | 1 | 0.6 | Philippines | 8 | 4.6 |
| Croatia | 1 | 0.6 | Poland | 1 | 0.6 |
| Czech Rep. | 6 | 3.4 | Portugal | 14 | 8.0 |
| Denmark | 1 | 0.6 | Rep. of Korea | 1 | 0.6 |
| Finland | 1 | 0.6 | Romania | 2 | 1.1 |
| France | 8 | 4.6 | Saudi Arabia | 1 | 0.6 |
| Germany | 2 | 1.1 | Slovenia | 1 | 0.6 |
| Ghana | 3 | 1.7 | South Africa | 3 | 1.7 |
| India | 3 | 1.7 | Spain | 10 | 5.7 |
| Indonesia | 1 | 0.6 | Sweden | 3 | 1.7 |
| Iran | 3 | 1.7 | Switzerland | 3 | 1.7 |
| Ireland | 1 | 0.6 | Turkey | 1 | 0.6 |
| Israel | 1 | 0.6 | UK | 10 | 5.7 |
| Italy | 42 | 24.0 | United States | 11 | 6.3 |
112 (64.0%) students were from Europe, 27 (15.4%) from Asia, 16 (9.1%) from North America, 8 (4.6%) from Africa, 6 (3.4%) from Australasia, and 6 (3.4%) from South America.
Survey Results. Overall evaluation of the course.
Results based on 21 survey answers submitted between April 29 and May 3, 2021.
Items included in the survey:
Item 1. Achievement of goals
Item 2. Relevance of contents
Item 3. Balance (methodology, computing, and data applications)
Item 4. Quality of the materials
Item 5. Engaging audience
Item 6. Clarity in communicating concepts and methods
Item 7. Support during training
Item 8. Usefulness of the material provided
Number of answers and percentages (total number of answers: 21).
| Item 1 | Item 2 | Item 3 | Item 4 | Item 5 | Item 6 | Item 7 | Item 8 | |
| Very Good | 16 | 16 | 15 | 14 | 12 | 16 | 10 | 13 |
| Good | 3 | 3 | 3 | 3 | 7 | 4 | 8 | 4 |
| Reasonable | 2 | 2 | 2 | 2 | 1 | 1 | 1 | 1 |
| Deficienty | 0 | 0 | 0 | 0 | 1 | 0 | 1 | 1 |
| Total | 21 | 21 | 20 | 19 | 21 | 21 | 20 | 19 |
| Very good (%) | 76.2% | 76.2% | 75.0% | 73.5% | 57.1% | 76.2% | 50.0% | 68.4% |
| Good (%) | 14.3% | 14.3% | 15.0% | 15.8% | 33.3% | 19.5% | 40.0% | 21.1% |
| Reasonable (%) | 9.5% | 9.5% | 10.0% | 10.5% | 4.8% | 4.8% | 5.0% | 5.3% |
| Deficient (%) | 0.0% | 0.0% | 0.0% | 0.0% | 4.8% | 0.0% | 5.0% | 5.3% |
| Total | 100.00% | 100.00% | 100.00% | 100.00% | 100.00% | 100.00% | 100.00% | 100.00% |
| Very Good & Good | 90.5% | 90.5% | 90.0% | 89,3% | 90.4% | 95.7% | 90.0% | 89.5% |
DOWNLOAD: report_iasc-ers_webinar_course_april2021